Geometrical Models


|
Geometrical Models |
|
SEE++ implements purely geometrical models (string model and tape model) as well as kinematic models with geometrical components (SEE-KID model, SEE-KID active pulley model and Orbit model). For the coordinate systems and the descriptions of eye positions and rotations, common guidelines known from eye research history are used.
One of the first attempts to get a better understanding of eye motility were the so-called ophthalmotropes. In 1845, Ruete designed a mechanical model of the human eye usually built out of wood and strings, in order to make it easier to study the basic principles of eye movements. In 1848, F. C. Donders introduced Donders' law: If the eye fixates an object somewhere in space, the position of this object also determines the gaze position of the eye. But the position of the object in space does not specify the amount of torsional rotation, nor is this amount of torsion arbitrary. In fact, the amount of torsion is clearly specified through the gaze position of the eye itself.
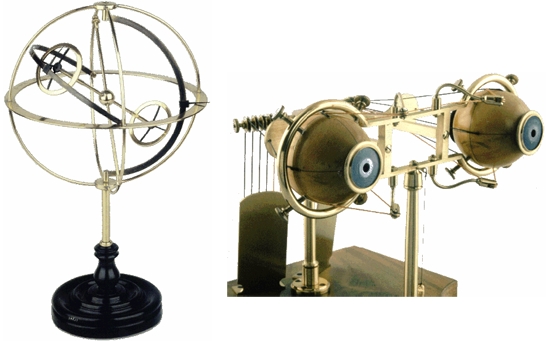
Halle's and Ruete's Ophthalmotrope [Simonsz and Tonkelaar, 1990]
When the German edition of Donders' work was published, it attracted the attention of H. Helmholtz, who found an explanation for the discovery of Donders. He termed the torsional rotation of the globe found by Donders as "Pseudotorsion", which results from a measurement error but actually does not really exist. Pseudotorsion is caused by the fact that, in tertiary gaze positions, the vertical meridian through the eye does not coincide with a vertical line in space, nor does the horizontal meridian coincide with a horizontal line in space. The reason for this discrepancy is that the meridians (cross on the cornea in SEE++) are defined in a globe-fixed coordinate system.
Pseudotorsion in Tertiary Gaze Position
Since pseudotorsion is caused by an unsuitably defined coordinate system, in 1853 J. B. Listing had the idea to use a polar coordinate system to overcome this problem. Thereby, he also discovered that all tertiary positions of gaze can be reached by a single rotation around one particular axis out of the primary position and moreover that all these rotation axes are part of the same plane (Listing's plane) with a constant torsional angle. This discovery was termed as Listing's law. Listing's law always describes the same torsional angle in a certain eye position, regardless of how this gaze position has been reached.
Listing's Plane of a Healthy Left Eye
As mentioned before, Listing's plane can be characterized by a visualization of the end points of the rotation axes which describe a 3D eye position starting from the primary position going into any other eye position. For a healthy eye, this plane lies parallel to the X-Z plane of the coordinate system (see figure). For a pathological eye, the plane is tilted according to the torsional effects of the particular pathology. Listing's plane can be visualized in the 3D-view of SEE++ according to the currently simulated pathology.
When Donders' law and Listing's law were published, there was a great demand for a standard definition for describing eye positions regarding the sequence of rotations around the different coordinate axes.
Geometrical Description of Eye Positions
Due to the non-commutativity of rotations in 3D space, it is necessary to use a standardized sequence of rotations in order to describe eye positions. For any eye position described by three component angles, also the applied sequence of rotations has to be specified. In 1854, A. Fick defined the so-called Fick sequence of rotations, where the first rotation has to be carried out around the vertical axis, then around the horizontal and finally around the torsional axis. In contrast, Helmholtz defined the sequence of rotations first around the horizontal, then around the vertical and finally around the torsional axis. Both rotation sequences describe a gimbal-mounted globe considering the particular sequence of rotations. From the illustration of the two systems (see following figure) it is easy to see that some specified angles of an eye position lead to different positions of the globe and thus to different eye positions when comparing both systems.
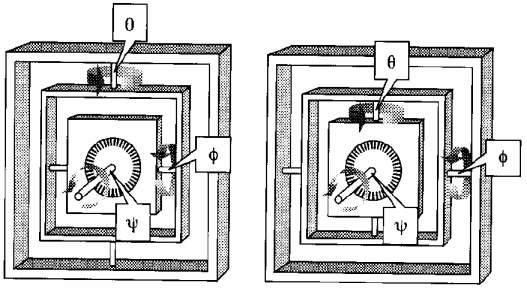
Gimbal Mounting According to Fick (Left) and Helmholtz (Right)
The SEE++ system generally uses the rotation sequence of Fick, which divides an eye position into three rotation angles, first around the vertical axis, then around the horizontal axis and finally around the torsional axis.
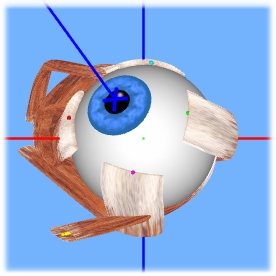
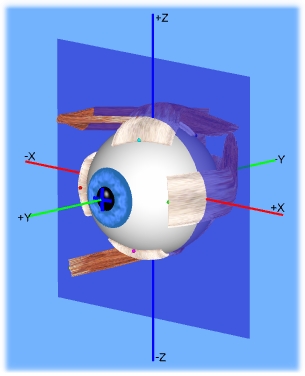
For a complete definition of eye positions, the used coordinate system is also of importance. The following figure visualizes the coordinate axes together with their algebraic signs and directions for both eyes.
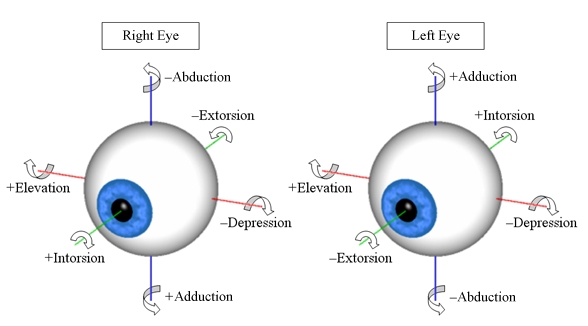
The Six Possible Rotation Directions of the Eyes
The coordinate system used for the extorsion is different for both eyes in terms of the ab-/adduction axis and the in-/extorsion axis. Directions of rotation around the respective axes can be described as follows (in the figure above the nose is assumed between the two eyes):
1. Rotation around z-axis (duction, blue)
positive angle = adduction (towards the nose)
negative angle = abduction (away from the nose)
2. Rotation around x-axis (elevation, red)
positive angle = elevation (upward)
negative angle = depression (downward)
3. Rotation around y-axis (torsion, green)
positive angle = intorsion (inward rolling)
negative angle = extorsion (outward rolling)
As shown in the figure above, the coordinate axes for ab-/adduction and in-/extorsion point in different directions for both eyes. This allows a standardized definition of the angle direction with consistent descriptions (e.g.: abduction = away from the nose). In both eyes, positive torsion is defined to rotate the eye inward around the line of sight. If the two axes did not have different signs, an intorsion of both eyes would mean that one eye rolls outward and the other one rolls inward. The axes for elevation and depression remain the same in both eyes, since up and down rotations specify the same directions for both eyes.
Additionally, in case of binocular eye movement, abduction of one eye results in adduction of the other eye, thus eye positions have to be mirrored for ab-/adduction and in-/extorsion movements.
Within the orbita, the eye is surrounded by flexible fat pads, which, besides rotation, permit globe translation up to a certain degree. Usually, this translation is negligibly small, however in some pathological situations involving co-contraction of muscles (e.g. Duane syndrome), additional information about globe translation becomes an important indication for the estimation and correction of a motility disorder. The SEE++ system calculates globe translation on demand and visualizes it in the 3D-view, whereby a forward movement of the globe along the y-axis is denoted as protrusion (globe translation with positive sign) and a backward movement is defined as retraction (globe translation with negative sign). The respective values for protrusion and retraction are shown in a textual form in the system for each eye position. In the 3D-view the user can choose whether to include globe translation in the visualization.
Geometrical Description of Muscle Action
In order to complete the definition of extraocular geometry, one also needs to consider the geometrical properties of muscles and their directions of pull. The geometrical description of a muscle is based on the definition of important designated points, whereas a muscle's force direction is specified by the definition of a rotation axis, around which a single muscle would rotate the globe. The geometrical description of a muscle is defined by a muscle path from the origin to the insertion. Attention should be paid to how this muscle path changes with different gaze positions and how it adapts to the position of the globe respectively.
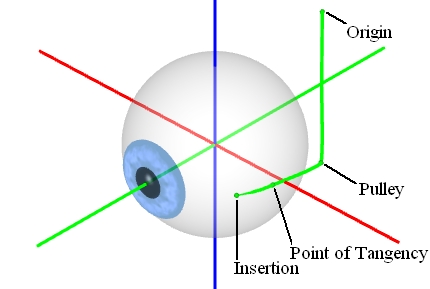
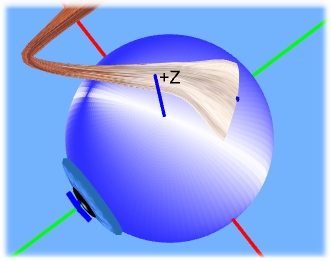
Definition of Muscle Path
The figure shows the path of the outer straight muscle (lateral rectus muscle), defined by origin, pulley, point of tangency and insertion. The muscle origin lies in the area of the posterior end of the orbita in the annulus of Zinn (Zinn's ring). The pulley stabilizes the muscle path in the rear area of the orbita. This point is not used in the string or tape model, since these two models assume a definition of the muscle path without pulleys. The point of tangency marks the area, where the muscle path first touches the globe. The distance between insertion and point of tangency is called arc of contact.
Reactions of the muscle path to changes in gaze position are differently represented by different models. Thus substantial differences exist in the definition of the muscle path between string model, tape model, Orbit model and SEE-KID model. String model and tape model exclusively use the anatomical origin of the muscle, the point of tangency and the insertion for the definition of the muscle path. However, SEE-KID model and Orbit model additionally consider pulleys. In the SEE-KID active pulley model, the pulley is finally even moved together with the globe.
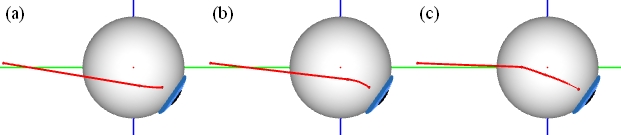
Comparison of (a) String Model, (b) Tape Model and (c) SEE-KID Model
In comparing the muscle path representation of these models (see figure), noticeable differences in representing the movement of the point of tangency occur. In the string model (a) as well as in the tape model (b), the point of tangency and hence the whole posterior muscle path moves downwards together with the globe. This also affects the direction of pull significantly in other gaze positions. Here the SEE-KID model (c) provides a much better prognosis. The introduction of pulleys results in a stabilization of a muscle's direction of pull and therefore a substantially more realistic prognosis can be made.
The description of the rotation axis of a muscle and therefore also the rotational effect of a muscle onto the globe are derived from the muscle path. The rotation axis of the string model and the tape model is perpendicular to the plane defined by insertion, point of tangency and origin. In the Orbit, SEE-KID and SEE-KID active pulley model the pulley point is additionally considered. The direction of pull of a muscle (rotation axis) can be represented in all three components (x, y, z) in a diagram, in order to get a better estimation of the rotational effect. The x-component of the rotation axis represents the portion of the elevation/depression that a muscle exerts on the globe, the y-component gives information on intorsion/extorsion and the z-component describes abduction/adduction.
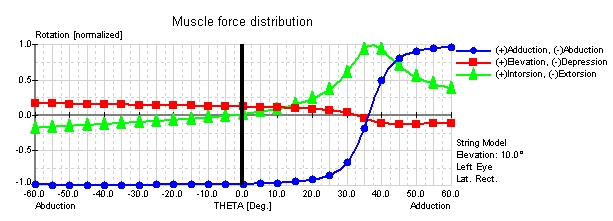
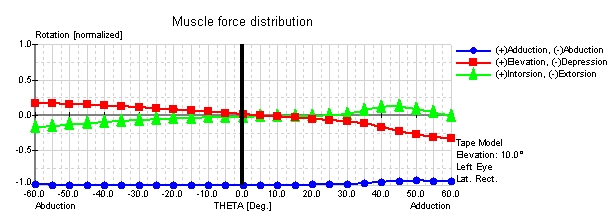
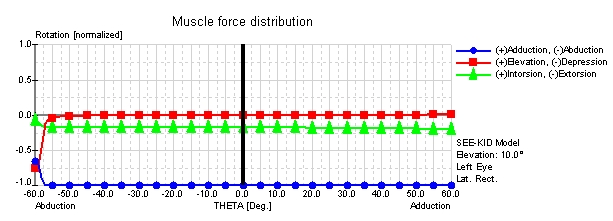
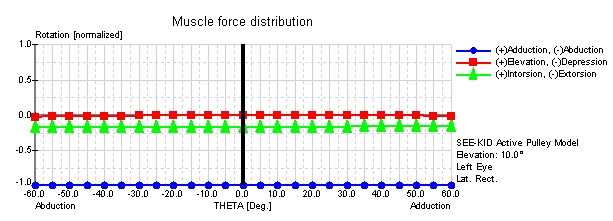
Muscle Force Distribution of the Lateral Rectus Muscle in the String, Tape, SEE-KID and SEE-KID Active Pulley Model
The muscle force distribution shows the relative rotational components for selected eye muscles along a horizontal view range (see figure) in a certain level of elevation or depression. The rotational components are indicated in standardized values between -1 and +1 for ab-/adduction, elevation/depression and in-/extorsion. The figure shows the force distributions of the lateral rectus muscle in the string, tape, SEE-KID and SEE-KID active pulley model with an elevation of 10 degrees along the horizontal view range (0.00-line in the figure) with up to 60 degrees abduction and adduction of a left eye.
Here, the physiologically incorrect prediction of the string model becomes clearly evident at approximately 36 degrees of adduction, where the lateral rectus muscle drastically changes its abducting effect into an adducting effect. In comparison with the tape model, a significantly better physiological muscle force distribution for the exact same scenario is shown by keeping up the main direction of pull of the lateral rectus muscle. These differences result from the differentiated mathematical modeling of the anatomical structures. In the string model, the muscle path in the contact area of the globe is defined by the shortest path between insertion and origin. In contrast, the tape model contains an angle-reducing component, which describes the muscle path by the relative movement of the point of tangency as a function of gaze position. This allows the simulation of stabilizing connective tissues and supporting ligaments in order to limit the movement of muscles in extreme gaze positions. Graphically, this simulation results in a bent muscle path between insertion and point of tangency, which substantially better, but not optimally, corresponds to anatomical conditions.
Only by the introduction of a model that considers pulleys, more detailed simulations and pathological case studies can be accomplished. The mathematical basis for such a model is the introduction of an additional functional origin (pulley) directly behind the anatomical equator of the globe. This results in a stabilization of the muscle path in the rear area of the orbita and the functional origin is now used for the definition of the muscle force distribution. The anatomical origin is mathematically not so important for defining the direction of pull depending on the gaze position. The simulation of pulleys in the SEE-KID model (as well as in the Orbit model) shows a significantly better stabilization of a muscle's main direction of pull in the muscle force distribution. However, at about 55 degrees there is still a slight change of the muscle's main direction of pull. With the introduction of "active pulleys", which are pulleys that change their position according to the current gaze position (SEE-KID active pulley model), the muscle force distribution shows a complete stabilization of a muscle's main direction of pull over the entire physiological range of vision from -60 to +60 degrees. Therefore, the SEE-KID active pulley model is the currently most suitable (geometrical) model.
The functional topography makes it possible to project the muscle force distribution onto the surface of the globe as a color-coded 3D visualization for all possible insertions of a muscle. Therefore, the insertion of a selected muscle is "virtually" moved to different locations on the globe and at each possible insertion the different rotational components (ab-/adduction, elevation/depression, in-/extorsion) are drawn onto the globe as color-coded brightness values (darker brightness values correspond to a high rotational component if the insertion of the selected muscle is moved to the respective location). The mapping of the different brightness value colors to the corresponding rotational components is the same as in the muscle force distribution diagram, which means that blue represents duction, red represents elevation/depression and green represents torsion. If more than one rotational component is shown at the same time, the colors of the selected rotational components are combined resulting in mixed colors.
By using this color-coding, it is now possible to find an "ideal" muscle insertion line for a certain muscle, where a certain rotational component should either be minimal (white or bright area on the globe) or maximal (dark area in the appropriate color on the globe). If the visualization of several rotational components is combined, intersection points can be found, where several components are minimal or maximal at the same time. These "ideal" insertion lines and intersection points in combination with the poles of the globe and the coordinate axes offer a useful support for planning surgeries.
The following figure shows the distribution of the horizontal rotational components (blue) of the left superior oblique muscle in primary position. Dark blue areas represent possible insertion positions, where the muscle would strongly rotate the eye into ab-/adduction, light blue or white regions represent areas, where the muscle would only little or not at all rotate the eye into ab-/adduction. Compared to the muscle force distribution diagram (MFDD - see definition of muscle force distribution) the direction a muscle would rotate the eye cannot be seen when using the functional topography (thus if a muscle with its insertion moved into an e.g. blue area would rotate the eye into adduction or abduction). The functional topography can be enabled in SEE++ by using the 3D-view options toolbar.
Functional Topography of Superior Oblique Muscle (Ab-/Adduction Component, Horizontal)
Geometrical Measurement of the Eye
Around 1989 a statistical analysis of several patients was carried out by A.W. Volkmann. The results of this study were published as data for a so-called "standard eye", which represents an average human eye. Based on Volkmann's data, the string model and the tape model were formulated. Later these basic geometrical data were extended, modified and the geometrical data of pulleys were added by Robinson and Miller.
These geometrical data have to be used according to the already defined coordinate system (see geometrical description of eye positions). SEE++ also offers a standard scenario containing the geometrical data by Volkmann.
Globe Radius: |
12.43 mm |
|
Cornea Radius: |
5.50 mm |
|
|
Origin (x / y / z) in mm |
Insertion (x / y / z) in mm |
medial rectus m. |
-17.00 / -30.00 / 0.60 |
-9.15 / 8.42 / 0.00 |
lateral rectus m. |
-13.00 / -34.00 / 0.60 |
10.44 / 6.75 / 0.00 |
superior rectus m. |
-16.00 / -31.78 / 3.80 |
0.00 / 7.33 / 10.05 |
inferior rectus m. |
-16.00 / -31.70 / -2.40 |
0.00 / 7.65 / -9.80 |
superior oblique m. |
-15.27 / 8.24 / 12.25 |
-0.07 / -8.05 / 9.48 |
inferior oblique m. |
-11.10 / 11.34 / -15.46 |
6.73 / -10.46 / 0.00 |
Geometrical Data According to Volkmann
The discovery of pulleys as functional elements in 1989 (Miller and Demer) revised these data:
Globe Radius: |
11.99 mm |
|
|
Cornea Radius: |
5.50 mm |
|
|
|
Origin (x/y/z) mm |
Insertion (x/y/z) mm |
Pulley (x/y/z) mm |
medial rectus m. |
-17.00/-30.00/1.00 |
-9.65/8.84/0.00 |
-14.00/-5.00/0.14 |
lateral rectus m. |
-13.00/-34.00/-1.00 |
10.08/6.50/0.00 |
12.00/-8.00/0.33 |
superior rectus m. |
-15.00/-31.76/3.60 |
2.76/6.46/10.25 |
-5.16/-10.78/10.00 |
inferior rectus m. |
-17.00/-31.76/-2.40 |
1.76/6.85/-10.22 |
-5.16/-8.78/-12.00 |
superior oblique m. |
-18.00/-31.50/5.00 |
2.90/-8.00/8.82 |
-15.27/11.00/11.75 |
inferior oblique m. |
-13.00/10.00/-15.46 |
8.00/-9.18/0.00 |
-13.00/10.00/-15.46 |
Geometrical Data According to Miller and Demer
Here the muscle insertions as well as the pulley positions were measured in three dimensions. This means that, with the geometrical abstraction to assume the globe as a spherical object, each muscle's insertion does not lie exactly on the globe, due to the fact that in reality the globe is shaped like an ellipsoid. This leads to a compromise in choosing the globe radius as the smallest distance between coordinate system origin and muscle insertion of all six muscles. The so-called "muscle-based globe radius", as well as the "actual" globe radius, can be easily changed by modifying the corresponding parameters in SEE++. The significant mathematical difference of these data is caused by the fact that now each muscle rotates its own "virtual globe", in turn affecting lever arm and force behavior.